

Kotak
Stockshaala
Fundamental vs Technical Analysis
Understand the difference between fundamental and technical analysis—when to use financial data vs. price charts for better investing and trading decisions.
How to Identify Market Trends
Learn to identify uptrends, downtrends, and sideways movements by analysing price highs and lows—essential for spotting market direction.

Support & Resistance Explained
Support and resistance act like floors and ceilings for stock prices. Learn to identify breakouts and breakdowns in stock charts.
Candlestick Patterns Explained
Learn how candlesticks are formed using OHLC data and how to spot bullish or bearish signals from candle shapes and wicks.
Hammer & Shooting Star Patterns
These candlestick patterns signal bullish and bearish reversals. Learn how to identify and trade them using real chart examples and key insights.
Marubozu Candlestick Pattern
Marubozu candles have no wicks and signal strong momentum. Learn how to spot bullish or bearish reversals using this powerful candlestick pattern.
Doji Candlestick Pattern Explained
Discover how Doji candles signal potential trend reversals. Learn the key types of Doji patterns and spot real reversal setups using charts.
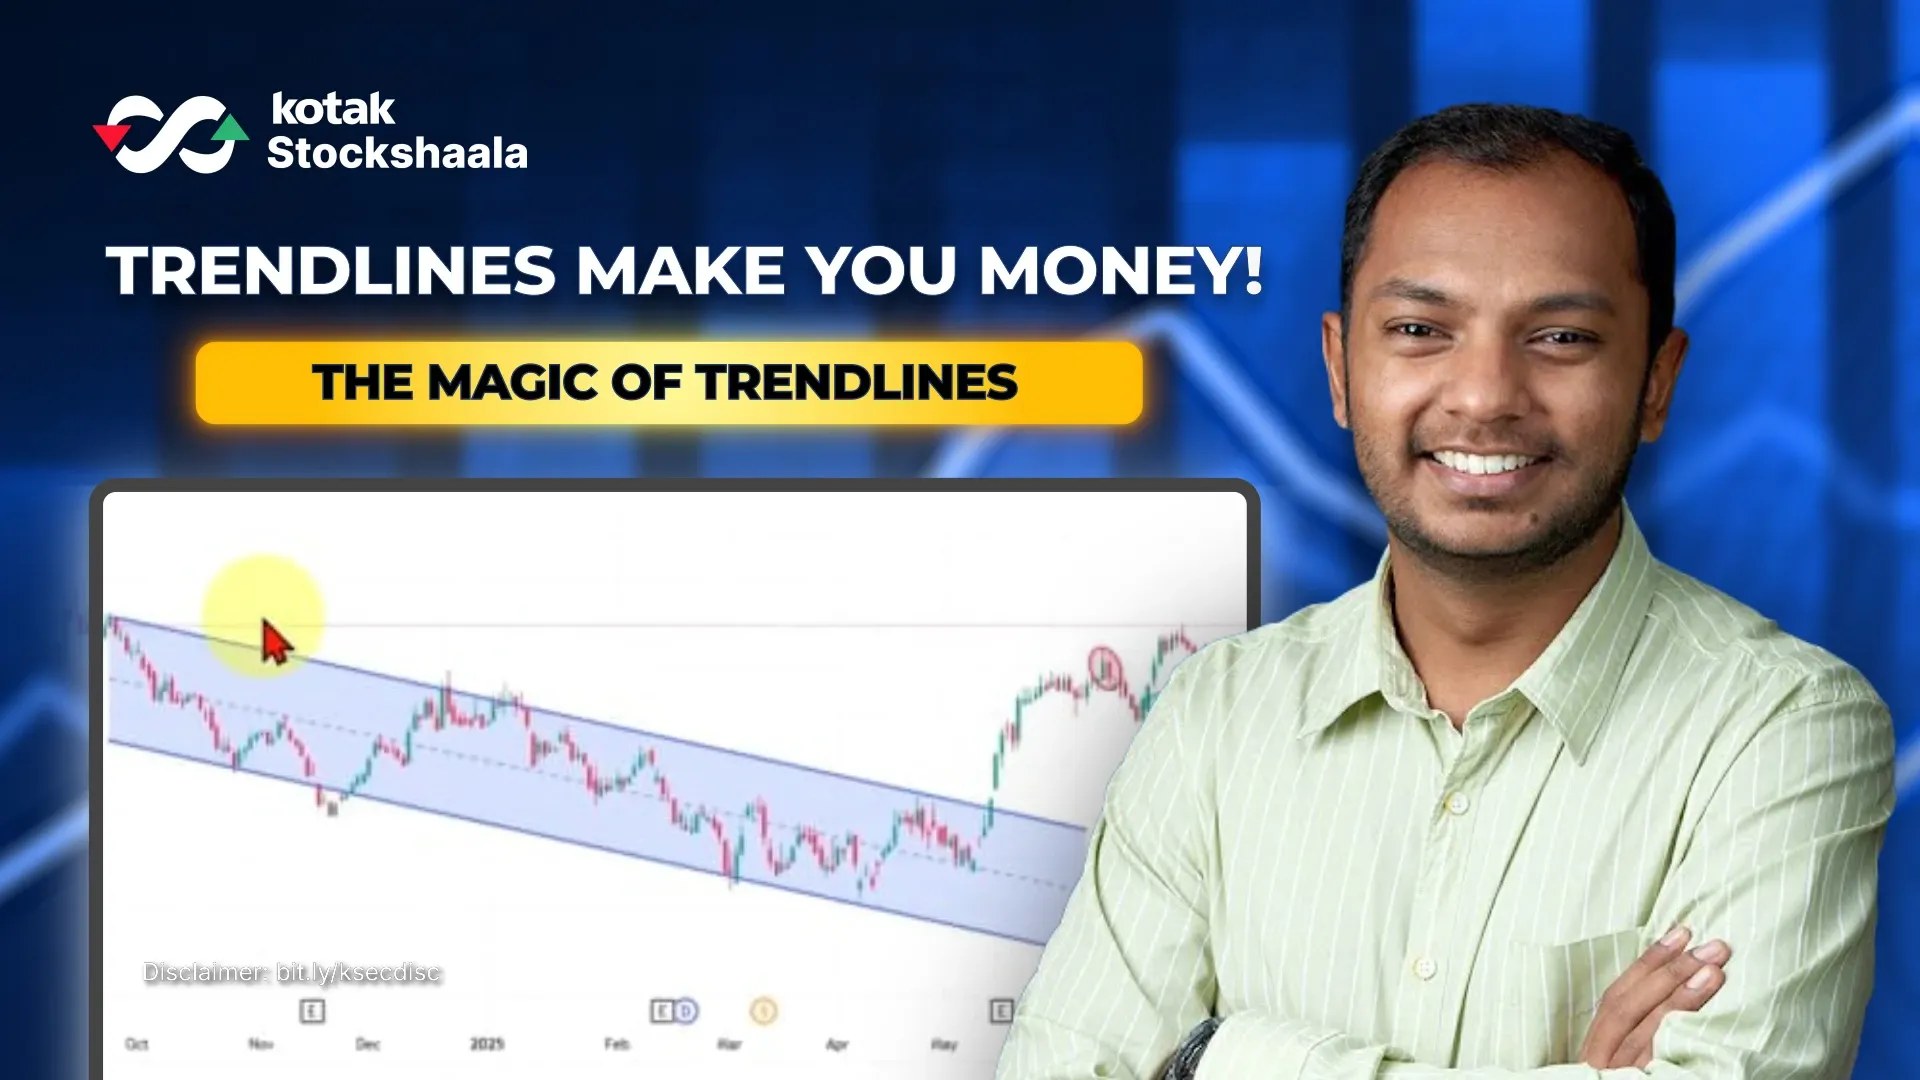
Trendlines – Basics & Psychology Behind Them
Trendlines act as moving support and resistance. Learn how repeated touches, breakouts, and psychology behind them can change your trades.

Channels – Price Trapped Between Two Lines
Price often moves within channels—rising, falling, or sideways. Learn how to spot these patterns, predict breakouts, and trade smarter inside and outside the channel.
Breakouts vs Fakeouts – The Truth Behind Explosive Moves
Not every breakout is real—many are fakeouts that trap traders. Learn how to confirm real breakouts, spot traps, and trade with confidence using volume and price action.

The Biggest Support & Resistance Mistake Traders Make (and How to Fix It)
Support and resistance are key zones, not fixed lines. Learn how to spot fake breakouts, confirm setups, and trade with confidence.
Retest Trading Strategy: Confirming Breakouts with Precision
Smart traders don’t chase breakouts—they wait for the retest. Learn how retests confirm true breakouts, reduce fakeouts, and lead to high-probability trades.
Trendline Breaks – Is the Trend Over
Not every trendline break means the trend is over. Learn how to spot fakeouts, real reversals, and avoid panic when prices break key levels.
How to Spot Trend Reversals
Learn to identify stock trend reversals using Dow Theory. Understand key signals like higher highs and lower lows to catch bullish or bearish shifts early.

Volume Basics – The Market’s Lie Detector
Volume is the market’s lie detector. Learn how to read volume with price action, confirm real breakouts, and spot smart money moves in your trades.
Volume + Price Action – Spotting Smart Money Moves
Learn how to read volume with price action to spot smart money moves, confirm breakouts, and avoid traps that mislead retail traders.
SMA vs EMA Explained – Build Stronger Trend Setups
Understand how SMA and EMA work, how they shape trend structure, and how to use them for support, resistance, and cleaner chart reading—perfect for building the foundation of any trading strategy.
Moving Averages for Trading Entries – Catch Trends Early
Learn how to combine moving averages with price action to time entries on pullbacks, avoid late signals, and filter out false crossovers in fast-changing markets.
Golden Cross vs Death Cross – What They Really Mean
Learn how Golden Cross and Death Cross signals actually work, when they’re reliable, and how to use them as trend confirmation—without falling for hype or fear-based interpretations.
MACD Indicator – Spot Trend Shifts, Time Entries & Avoid False Crossovers
Learn how to read MACD the right way by identifying true trend shifts, spotting reliable crossovers, using divergences, and avoiding the false signals that trap most traders.
RSI Indicator – Read Momentum, Spot Reversals & Avoid False Signals
Learn how to use RSI the right way by reading momentum shifts, spotting high-probability reversals, and filtering out misleading overbought–oversold signals.
Combining Indicators – Use Trend, Momentum & Volume Without Overloading Charts
Learn how to combine trend, momentum, and volume indicators the right way so you avoid cluttered charts and build clean, high-probability trading setups.
Structure vs Indicators – What Really Comes First in Trading?
Understand why market structure must come before indicators, how the SFI (Structure–Flow–Indicator) approach works, and how focusing on structure helps traders avoid false signals and build cleaner, higher-probability setups.
Market Order vs Limit Order – When to Use Which
Learn how to choose between market and limit orders by understanding liquidity, volatility, and entry context—so you avoid slippage and get cleaner, planned executions.

High-Probability Trading Setup – The 5-Step Blueprint
Learn how to build a high-probability trading setup using a simple 5-step process that combines structure, confluence, indicators, and risk management for clean, logical trades.
Exit Strategies That Actually Work – How to Book Profits Without Regret
Learn three practical exit strategies—target-based, trailing stop-loss, and structure-based—to avoid emotional exits and book profits confidently without regret.
Stop-Loss Mastery – How to Protect Your Capital the Smart Way
Learn how to place smart stop-losses using structural, indicator-based, and fixed-point methods—so you protect capital, avoid common mistakes, and stay in the game longer.
Backtesting 101 – Validate Strategies Before You Risk Capital
Learn how to backtest and forward-test trading strategies to check what actually works before going live. This video explains a practical, data-driven process to measure performance, avoid false confidence, and trade with proof instead of hope.
The 3 Pillars of Successful Trading – Setup, Risk & Psychology
Learn why consistent trading depends on more than just strategies. This video breaks down how setup selection, risk management, and psychology work together to build a disciplined, repeatable trading system.
Position Sizing Explained – The 1–2% Rule That Protects Your Capital
Learn why position sizing matters more than strategy. This video explains the 1–2% risk rule, how to calculate the right quantity, and how proper sizing helps you survive losing streaks and trade consistently.
Risk of Ruin Explained – Why Traders Blow Up Despite Good Win Rates
Learn what Risk of Ruin really means and why traders lose accounts even with decent win rates. This video explains position sizing, losing streaks, and simple rules professionals use to survive and trade long term.
Multi-Timeframe Analysis – Read the Bigger Trend, Trade with Clarity
Learn how to use multi-timeframe analysis to align higher and lower charts, identify the main trend, refine entries, and avoid noise-driven trades. A practical guide to trading with structure and clarity.
Gap Trading Explained – Breakaway, Runaway & Exhaustion Gaps
Learn why gap ups and gap downs occur and how to trade them safely. This video explains the three major types of gaps, common traps traders fall into, and how to use price, volume, and levels to avoid blind entries.

Event Trading Strategy – How to Trade Budget, Fed & Earnings Volatility
Learn how professional traders handle high-volatility event days like Budget announcements, Fed policy, and earnings. This video explains when to trade, when to stay out, and how to manage risk during sharp moves and gaps.
Recommended Courses for you


Learn, Invest, and Grow with Kotak Videos
Explore our comprehensive video library that blends expert market insights with Kotak's innovative financial solutions to support your goals.

Trading with collateral as margin with Kotak Neo

How India is Redefining Space Exploration

